
Flash Reports! Great Management Decisions Should be Based on Data

There are so many moving parts to worry about when managing your business. And to make a hard job even harder, accounting systems never seem to have a single report that draws all your most important data together in one place.
Key Ingredients
Instead of relying on 12 different financial reports, build one good Flash Report. This will be the one report you need to keep your “finger on the pulse” of your business.
What should you put on it? For most small businesses, the best management decisions will come from clear and up-to-date information about just 4 key metrics:
- Current Cash Position
- Sales & Revenue – both Forecast and Actual
- Production Backlog
- Operating Expenses
And finally, when you know these things, you can create the most important data points of all — a true cash forecast — by adding up the other key metrics:
Cash + Revenue Forecast + Backlog + Sales Forecast – Expenses = Cash Forecast
Tracking these 4 metrics daily (or at least weekly) on a single page will create an useful and important tool that will improve every management decision you make.
How to Flash
Since most accounting packages do not report this level of detail, the best Flash reports are simple spreadsheets. This will require some poking around at first — finding all the right data may require you to run several reports from your accounting software or CRM. But if you’re a bit more sophisticated, tie the Flash report to the raw data via links so that the metrics are updated automatically.
And if you want to really go for the gusto, here are some other Key Performance Indicators (KPI’s) that you might want on an expanded version of your Flash Report:
- Payroll dates and amounts
- Sales pipeline
- Project status
- Employee reviews due
- Taxes due
- Other items that effect cash flow
Sample FLASH Spread Sheet
Here is a sample of a FLASH Report for a small business where the KPI’s are cash, payroll expense and sales:
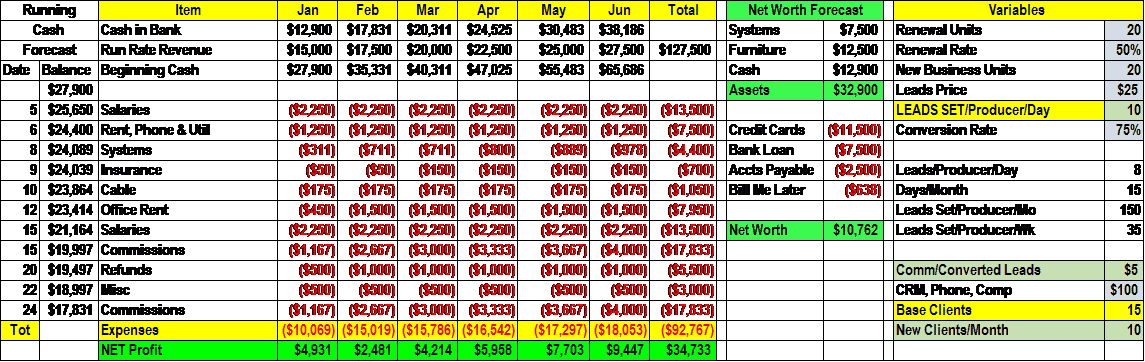
This example report has a running cash balance along the left hand side that reflects expenses as they occur throughout the month. It starts with the existing cash balance, adds the revenue forecast, and then tracks the expenses as they occur. The revenue forecast is tied to a sales forecast that includes existing clients and forecasted sales for the month.
The variables on the right side generate many of the revenues and expenses. The middle section shows assets, liabilities and net worth. This is a good snapshot of current cash position, forecasted profits and net worth.
Your report will vary because you may wish to track different things, but the idea is to have everything that is most important to your business in one place. Your rewards will be a snapshot of the state of your business, and the ability to make better, more profitable decisions.
 About the Author: Bruce Lande is the founder and lead writer for Business Writers for Hire. He researches and creates business articles in many different industries. His specialty is translating technical jargon into Business English. Business Writers takes a concept or an idea, researches for citations, develops original content and delivers articles, content, posts and more.